GRAPHS THAT WILL MAKE YOU GASP
Send us gasp-worthy graphs that you think should be linked to or listed on this website! Email Jenny Mansbridge (jane_mansbridge@harvard.edu) with suggestions.
GRAPHS TO MAKE YOU GASP #1:

“Gender Differences in Accepting and Receiving Requests for Tasks with Low Promotability”
By Linda Babcock, Maria P. Recalde, Lise Vesterlund, and Laurie Weingart
Gender differences in task allocations may sustain vertical gender segregation in labor markets. We examine the allocation of a task that everyone prefers be completed by someone else (writing a report, serving on a committee, etc.) and find evidence that women, more than men, volunteer, are asked to volunteer, and accept requests to volunteer for such tasks. Beliefs that women, more than men, say yes to tasks with low promotability appear as an important driver of these differences. If women hold tasks that are less promotable than those held by men, then women will progress more slowly in organizations. American Economic Review 2017, 107(3): 714-747. View it Here!
GASP-WORTHY GRAPH #2: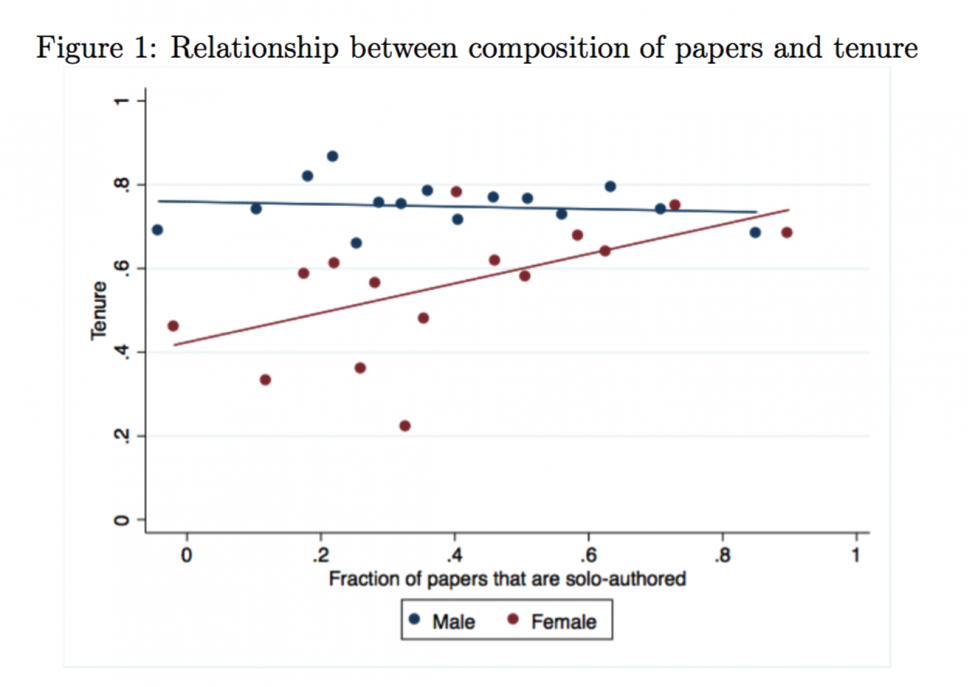
In Economics, women who single-author papers are just as likely to get tenure as men who single-author papers. But the more papers a woman co-authors, the less likely she is to get tenure. Men are not penalized for co-authorship when coming up for tenure; women are. In further analysis, the penalty for co-authorship appears only when women co-author with men and disappears when women co-author with other women. One possible mechanism is that men’s names are remembered (perhaps because their names are known through friendship networks) and so they get more of the credit for co-authored papers. Another is that, as experimental studies on teamwork show, women are less likely to take credit publicly than men in mixed-gender teams, but not when the work is with other women. Another is simple discrimination. (Source: Heather Sarsons, “Gender Differences in Recognition for Group Work,” August 9, 2015.) For newspaper coverage, see: https://www.washingtonpost.com/news/wonk/wp/2015/11/13/why-men-get-all-the-credit-when-they-work-with-women/.
GASP-WORTHY GRAPH #3:
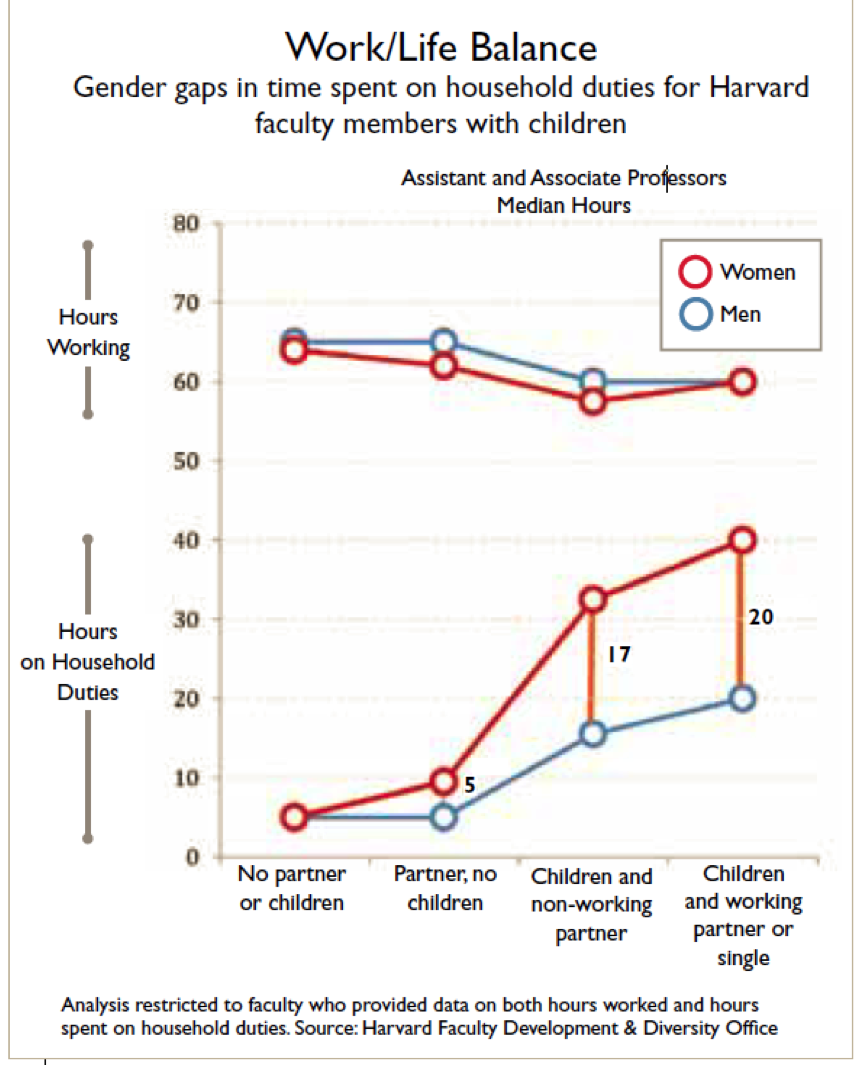
Although both female and male assistant and associate professors (both categories are untenured at Harvard) lose about the same number of hours in their work week (about 5 hours a week) when they have a child, women faculty with children report spending, on average, 17-20 more hours a week than their male peers with children “engaged in household, childcare, and/or adult care duties.” The difference for the women faculty presumably comes in the loss of leisure and/or sleep. (Source Harvard University 2013 Faculty Climate Survey: https://www.faculty.harvard.edu/sites/default/files/FCS16final.pdf)
GASP-WORTHY GRAPH #4:
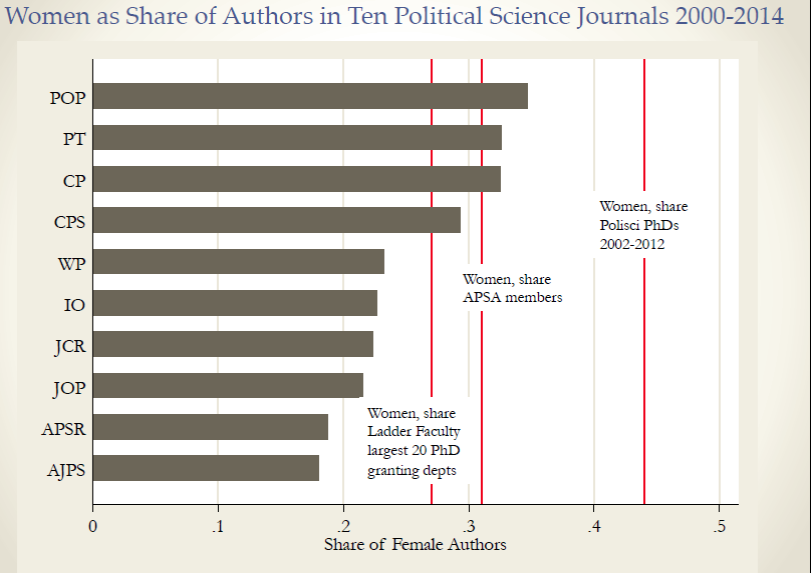
Except in Perspectives on Politics, Political Theory, and Comparative Politics, the percentage of women publishing in the major political science journals is considerably less than the percentage of women in the association. (Source: Dawn Langan Teele and Kathleen Thelen, “Gender and Publication in Political Science,” Presentation at the 2015 Annual Meeting of the American Political Science Association. See teele@sas.upenn.edu and kthelen@mit.edu for details.)
GASP-WORTHY GRAPH #5:
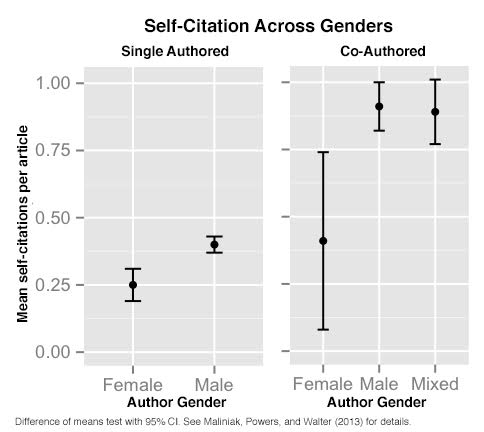
Women are less likely than men to cite their own papers, whether the papers are single-authored or co-authored. (Data drawn from Daniel Maliniak, Ryan Powers and Barbara F. Walter, “The Gender Citation Gap in International Relations” 2013. International Organization 67 (4): 889-922).The same article reports that “scholars tend to cite work by scholars of the same gender. This does not necessarily pose a problem for citation counts if a field has a fairly equal number of male and female scholars. If, however, a field is heavily dominated by men, as is the case in IR, then this pattern will lead to significantly fewer citations for women and significantly less exposure for their scholarship. …Scholars [also] tend to cite scholars they know…. If networks tend to bifurcate along gender lines, then any field that is disproportionately male will also disproportionately favor their work” (Maliniak, Powers & Walter 2013: 918, emphasis ours). The CSWP notes that many fields in political science are gender-imbalanced and most friendship networks in political science have a strong gender component. The imbalance in citations is thus likely to apply in many fields.
GASP-WORTHY GRAPH #6:

On RateMyProfessor.com, students use the word “brilliant” more often to describe male than female professors. They also use the word more in Political Science than in any other field except Philosophy. This graph comes from an online interactive tool developed by Benjamin Schmidt (Northwestern), which lets you choose your own words and search to see whether those are used more to describe women than men or vice versa in the different disciplines. Click Here! to use this tool yourself and choose your own words. (Try “arrogant.”)
GASP-WORTHY GRAPH #7:
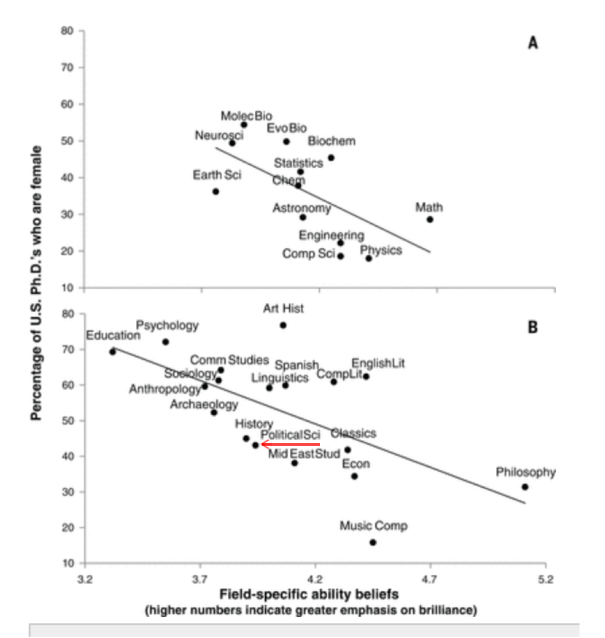
The more that academics in a field think that “Being a top scholar of [discipline] requires a special aptitude that just can’t be taught” and other questions designed to measure a belief in the requirement of innate brilliance, the fewer women are in that field. Compare Math and Physics to Neuroscience and Molecular Biology, and Philosophy to Psychology. Political Science falls in the middle on both measures. If one were to look at subfields within political science, one might find the same pattern. (Source: Sarah-Jane Leslie, Andrei Cimpian, Meredith Meyer and Edward Freeland, 2015. “Expectations of brilliance underlie gender distributions across academic disciplines.” Science 347 (6219): 262-265.)
GASP-WORTHY GRAPH #8:
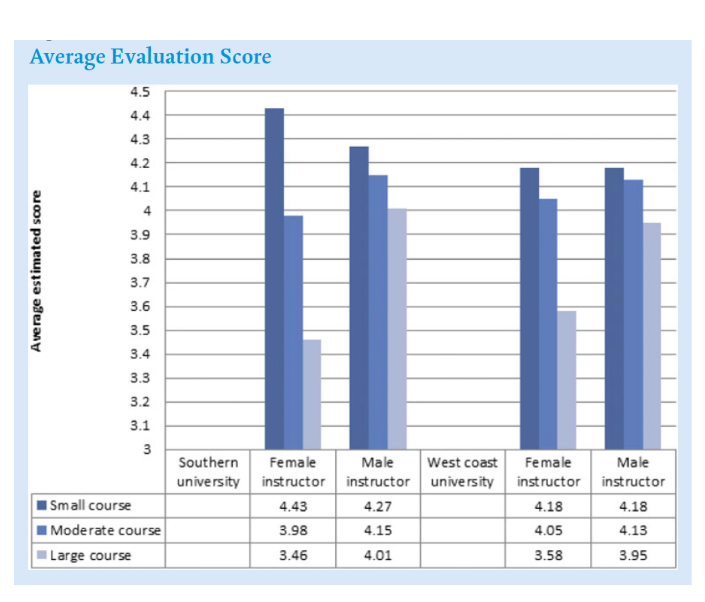
Although in small courses students evaluate women instructors as highly or even better than men, in moderately sized or large courses they evaluate women systematically lower. The differences might derive from stereotypes of female nurturance and male authority. Tenure and promotion committees should recognize these consistent biases. (Source: Lisa Martin, “Gender, Teaching Evaluations, and Professional Success in Political Science.” 2016. PS: Political Science and Politics 49 (2): 313 – 319.)
GASP-WORTHY GRAPH #9:

The table above signifies the unintended consequences of extending the Tenure Clock for females (Source: Heather Antecol, Kelly Bedard, and Jenna Stearns, “Equal but Inequitable: Who Benefits from Gender-Neutral Tenure Clock Stopping Policies?” Apr. 18, 2016. Discussion Paper Series. PDF Here
GASP-WORTHY GRAPH #10
CAN YOU FIND THE ARTICLES BY WOMEN? (HINT: LOOK FOR THE GREEN)
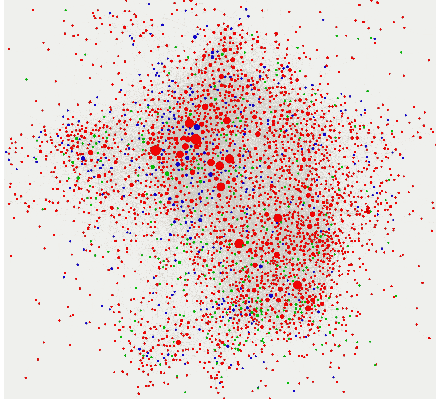
Notes: Green nodes are authored by all females. Red nodes are authored by all males. Blue notes are authored by at least one male and at least one female. The size of the node is proportional to its HITS centrality score
FIGURE 2. Visualization of citation network
This figure shows that in International Relations, in general authors cite articles written by female authors less than articles by men; moreover, authors of the most influential articles cite articles by female authors less often. (The size of circle in the figure derives both from the numbers of times an article is cited and from the numbers of times the citing author is cited by others.) Friendship networks may have an effect: Men tend to cite male-authored articles more than average and women tend to cite female-authored articles more than average. Men also are about half again as likely as women to cite their own single-authored work (difference significant at the .001 level; see Gasp-worthy Graph #5 at link). (Source: Daniel Maliniak, Ryan Powers and Barbara F. Walter, “The Gender Citation Gap in International Relations” 2013. International Organization 67 (4): 889-922: 912.)
GASP-WORTHY GRAPH #11
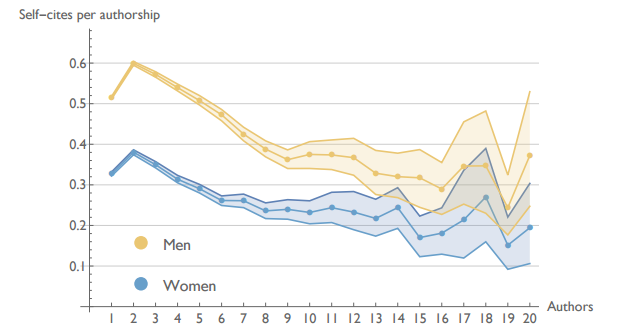
The Figure above shows the Mean number of self-cites per authorship by the number of authors on a paper, in JSTOR, 1779-2011. Results are truncated at 20 authors because, given small sample sizes, the data become excessively noisy beyond that threshold. (Source: Molly M. King, Carl T. Bergstrom, Shelley J. Correll, Jennifer Jacquet, and Jevin D. West, “Men Set Their Own Cites High: Gender and self-citation across fields and over time” Copyright, 2016. PDF Here
GASP-WORTHY GRAPH #12:
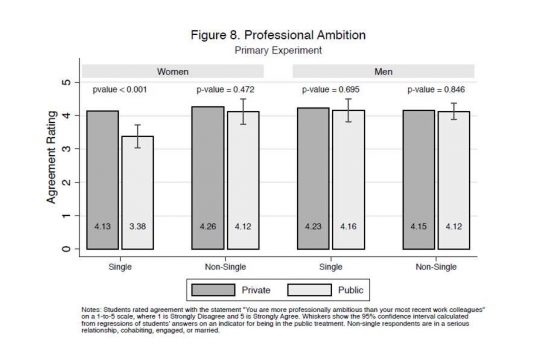
Bursztyn, Fujiwara, and Pallais Figure 8, p.28) present evidence suggesting that single women avoid signaling career ambition that could hurt them on the marriage market.
GASP-WORTHY GRAPH #13
 |
 |
 |
 |
Emergent gendered attitudes toward brilliance: The distribution of women and men across academic disciplines seems to be affected by perceptions of gender differences in intellectual brilliance. Bian et al. found that these differential perceptions emerged between ages 5 and 6. By age 6, girls were prepared to lump more boys into the “really, really smart” category and to steer themselves away from games intended for the “really, really smart.” Lin Bian, Sarah-Jane Leslie and Andrei Cimpian, “Gender stereotypes about intellectual ability emerge early and influence children’s interest,” Science 355 (6323): 389-391 (January 26, 2017).
GASP-WORTHY GRAPH #14:

Resume audit study with law firms showing that cues of affluent background helped men but hurt women! Firms expected rich women to quit career jobs for helicopter mothering. Check out the article here.